How to read supply and demand zones
Updated 2026-10-12
A supply or demand zone is an area on the chart where price turned sharply before, because one side (buyers or sellers) was clearly in control. Zones do not predict the future; they show where the market reacted, so you know which areas are worth watching when price returns.
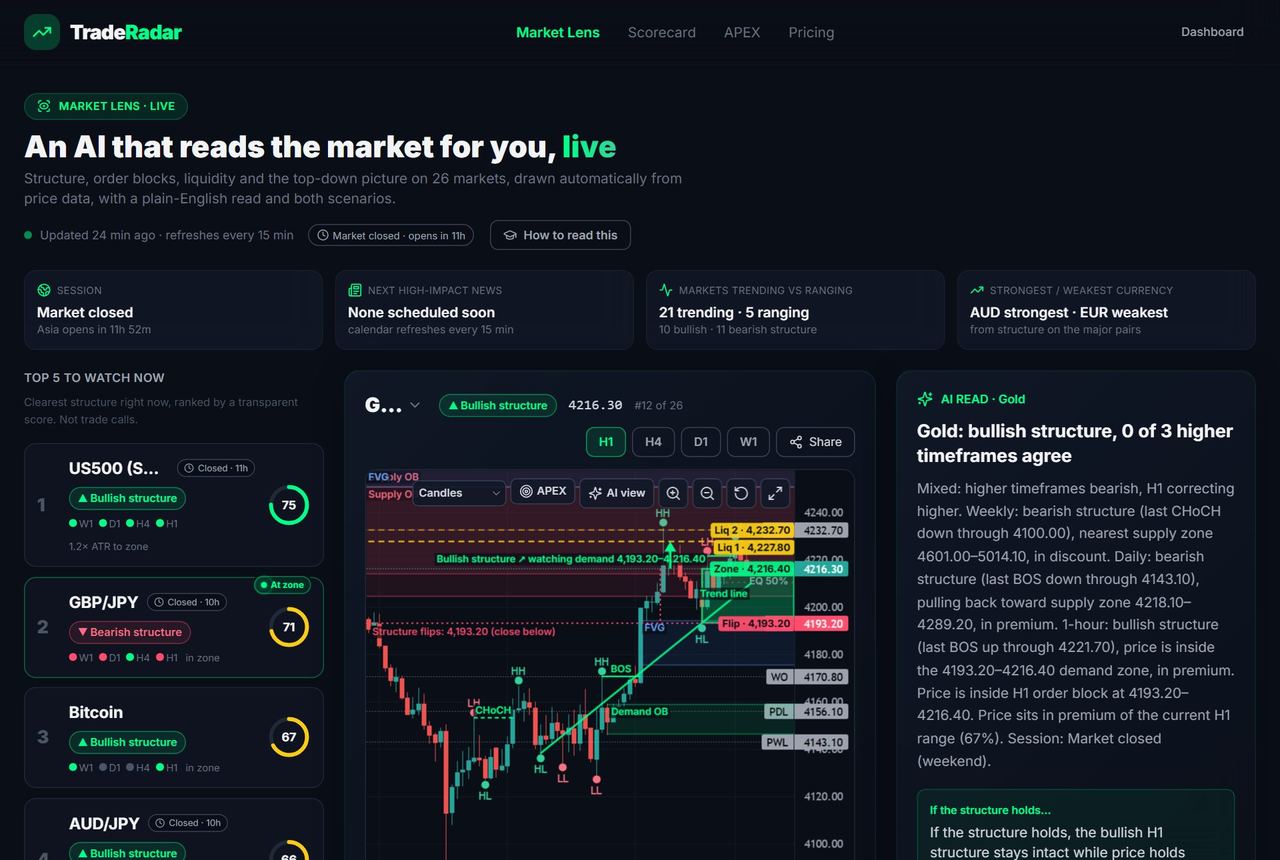
Demand zones and supply zones
A demand zone is the base a strong move up started from: buyers absorbed all the selling there. A supply zone is the base a strong move down started from. When price comes back to the zone, traders watch whether the same side shows up again (the zone holds) or whether price cuts straight through (the zone breaks).
Zones are areas, not exact prices. That is why they are drawn as boxes with a top and a bottom.
Order blocks and fair value gaps
Two common ways to define a zone:
- Order block (OB): the last opposite-coloured candle before the strong move that broke structure. For a bullish move, the last down candle before the rally.
- Fair value gap (FVG): a three-candle pattern where the move was so fast that the first and third candles do not overlap, leaving a gap in the price range. Price often comes back to fill part of it.
Fresh, tested and broken zones
A fresh (unmitigated) zone has not been revisited since it formed. A tested zone has been touched once already; part of the orders there have been used. A zone is broken when price closes through the far side. Many traders only pay attention to fresh zones in the direction of the higher-timeframe structure.
Read zones top-down
A zone on the 1-hour chart means more when the weekly, daily and 4-hour structure point the same way. A demand zone in a market whose daily structure is bearish is a counter-trend area: it can still hold, but it is fighting the bigger picture. See BOS vs CHoCH for how structure direction is defined.
How often do zones hold?
Not as often as social media suggests. TradeRadar publishes every Market Lens zone that price reached and whether it held, broke or expired, misses included, on the public Scorecard. Use zones as a map of where to pay attention, never as a guarantee.
How to find a supply or demand zone on a chart
- Find the structure direction. On the daily and 4-hour charts, mark the swing highs and lows and decide whether the structure is bullish (higher highs and higher lows), bearish or ranging.
- Find a strong move that broke structure. Look for a fast, large-bodied move that broke the previous swing high (bullish) or low (bearish).
- Mark the base it started from. Draw a box around the last opposite candle before the move (the order block), from its high to its low, or around the fair value gap the move left behind.
- Check it is still fresh. If price has already come back and traded through most of the box, the zone is tested or broken.
- Watch the reaction, do not assume it. When price returns, watch whether the zone holds or breaks. Know in advance where the structure would flip (a close beyond the last swing).
Frequently asked questions
What is the difference between a supply zone and a demand zone?
A demand zone is where a strong move up began (buyers in control); a supply zone is where a strong move down began (sellers in control).
Is an order block the same as a demand zone?
An order block is one specific way of drawing a zone: the last opposite candle before a move that broke structure. Many traders use the two terms for similar areas.
Which timeframe is best for supply and demand zones?
Higher timeframes (daily, 4-hour) give the direction; many traders then use the 1-hour or lower for the zone itself. Zones that line up with the higher-timeframe structure are generally considered stronger.
Do supply and demand zones always work?
No. Zones break regularly. TradeRadar's public Scorecard lists how every Market Lens zone played out, including the ones that broke.
Related
Go further with TradeRadar
Free account
Today's #1 market read in full, one more market of your choice every day, and the 06:30 "top 5 to watch" email. No card.
Market Lens, live
The interactive chart with every zone, BOS/CHoCH, liquidity and premium/discount drawn on H1, H4, D1 and W1 for 26+ markets, refreshed every 15 minutes.
Open Market LensTrade Panel for MT5
The same structure read on the chart you trade in MetaTrader 5 or 4, with a lot size from your risk %. Nothing is placed without your Yes.
See the Trade Panel