US500 (S&P 500) today: structure and drivers
US500 tracks the S&P 500, the benchmark for the US stock market and the index most global investors measure risk appetite by. When the S&P falls hard, the rand and other risk assets usually feel it.
US500 (S&P 500) structure today: the bias on every timeframe
US500 (S&P) is bullish on every timeframe.
| Timeframe | Structure | What it means |
|---|---|---|
| Weekly (W1) | Bullish | Higher highs and higher lows |
| Daily (D1) | Bullish | Higher highs and higher lows |
| 4-hour (H4) | Bullish | Higher highs and higher lows |
| 1-hour (H1) | Bullish | Higher highs and higher lows |
Clarity score 75/100 · 3 of 3 higher timeframes agree with the 1-hour · read top-down: W1 → D1 → H4 for direction, H1 for the zone.
US500 (S&P 500) chart (4-hour)
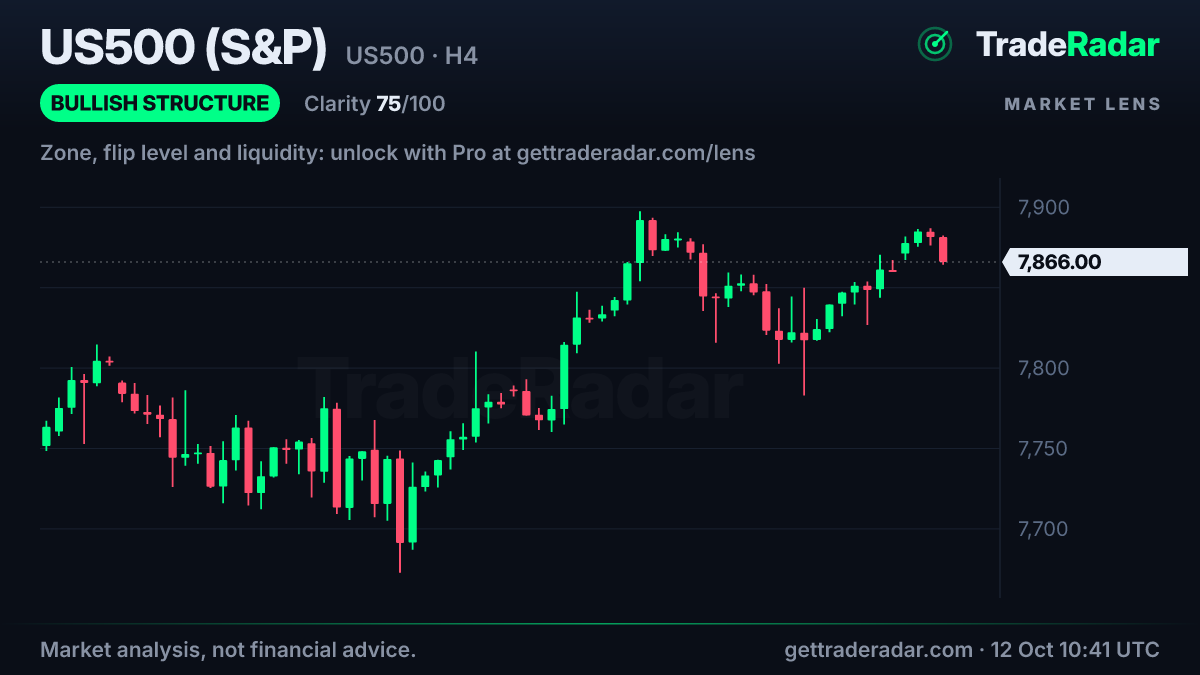
Candles and bias are public. The zones, the flip level and the liquidity on this chart open with a free account (one market a day) or Pro. Open the live interactive chart.
The structure read in plain English
US500 (S&P) is lined up bullish from the weekly chart down to the 1-hour: weekly, daily, 4-hour and 1-hour structure all point the same way.
The nearest 1-hour demand zone is a few hourly ranges away. Structure clarity is 75/100 (clear): swings and timeframes agree well.
Session right now: London.
US500 (S&P 500) key levels today
The nearest 1-hour demand zone is a few hourly ranges away.
The exact zone, the structure flip level, the liquidity above and below and the previous day and week highs and lows for US500 (S&P 500) are open today for Pro, or free with the daily unlock on a free account. Every page shows the bias for free; levels are where the work is.
Already have an account? Open US500 (S&P 500) on Market Lens.
What moves US500 (S&P 500)
Corporate earnings
Quarterly earnings seasons (January, April, July, October) move the index as the largest companies report.
The Fed and bond yields
Rate expectations set the valuation investors are willing to pay; CPI and FOMC days are the big ones.
Economic growth
Jobs, retail sales and ISM data show whether profits can keep growing.
Risk sentiment
The S&P is the global risk barometer: a falling S&P usually lines up with a rising USD/ZAR and a firmer yen.
Upcoming high-impact events for US500 (S&P 500) (SAST)
| When (SAST) | Event | Currency |
|---|---|---|
| Existing Home Sales | USD | |
| Inflation Rate MoM | USD | |
| Inflation Rate YoY | USD | |
| Core Inflation Rate YoY | USD | |
| Core Inflation Rate MoM | USD | |
| PPI MoM | USD | |
| Retail Sales MoM | USD | |
| Fed Chair Warsh Speech | USD |
High-impact releases for the currencies that move US500 (S&P 500), next 7 days. Spreads can widen and price can gap around them. Full economic calendar in SAST.
US500 (S&P 500) trading hours in South African time
Open now: closes Mon 12 Oct, 23:00 SAST.
- CFD trading runs almost 24 hours from 00:00 SAST on Sunday night to 23:00 SAST on Friday, with a daily break from 23:00 to 00:00 SAST.
- The New York cash session (the busiest hours) runs 15:30–22:00 SAST.
Times are for this week's US and UK clock settings; South Africa stays on SAST (UTC+2) all year. All forex sessions in SAST.
Trading US500 (S&P 500) from South Africa
Watch US500 even if you only trade the rand: a sell-off in US stocks is one of the most reliable reasons for the rand to weaken. Cash session: 15:30–22:00 SAST in US summer time, 16:30–23:00 in the US winter.
Contract and pip value: Measured in points. Commonly $1 or $10 per point per lot depending on the broker.
Size a position from your stop and your rand risk with the lot size calculator, or check what a pip is worth with the pip value calculator in rand.
Frequently asked questions
Is US500 (S&P 500) bullish or bearish today?
At Mon 12 Oct, 11:45 SAST the 1-hour structure on US500 (S&P 500) was bullish, with the weekly bullish, the daily bullish and the 4-hour bullish. This page refreshes every 15 minutes. It describes the current market structure, not a forecast or a recommendation.
What time does US500 (S&P 500) trade in South Africa?
CFD trading runs almost 24 hours from 00:00 SAST on Sunday night to 23:00 SAST on Friday, with a daily break from 23:00 to 00:00 SAST. The New York cash session (the busiest hours) runs 15:30–22:00 SAST.
How does the S&P 500 affect the rand?
When US stocks sell off, investors usually pull money out of emerging markets, which weakens the rand (USD/ZAR rises). A calm, rising S&P tends to help the rand.
Is US500 the same as SPX500?
Yes. US500, SPX500 and US SPX 500 are broker names for CFDs on the S&P 500.
Related markets
Go further with TradeRadar
Free account
Today's #1 market read in full, one more market of your choice every day, and the 06:30 "top 5 to watch" email. No card.
Market Lens, live
The interactive chart with every zone, BOS/CHoCH, liquidity and premium/discount drawn on H1, H4, D1 and W1 for 26+ markets, refreshed every 15 minutes.
Open Market LensTrade Panel for MT5
The same structure read on the chart you trade in MetaTrader 5 or 4, with a lot size from your risk %. Nothing is placed without your Yes.
See the Trade PanelLast updated . General market analysis generated automatically from price data, refreshed every 15 minutes. Not financial advice and not a recommendation to buy or sell. TradeRadar is not an authorised financial services provider. Trading leveraged products such as CFDs carries a high risk of losing money.