USD/ZAR today: rand structure and what is moving it
USD/ZAR is the price of one US dollar in rand, so a rising chart means a weaker rand. It is the most traded emerging-market currency pair and the one most South African traders watch first, because it moves with both local news (the SARB, Eskom, the budget) and global risk appetite.
USD/ZAR structure today: the bias on every timeframe
USD/ZAR: bearish 1-hour against the bigger picture.
| Timeframe | Structure | What it means |
|---|---|---|
| Weekly (W1) | Ranging | Overlapping swings, no clear direction |
| Daily (D1) | Bullish | Higher highs and higher lows |
| 4-hour (H4) | Ranging | Overlapping swings, no clear direction |
| 1-hour (H1) | Bearish | Lower highs and lower lows |
Clarity score 55/100 · 0 of 3 higher timeframes agree with the 1-hour · read top-down: W1 → D1 → H4 for direction, H1 for the zone.
USD/ZAR chart (4-hour)
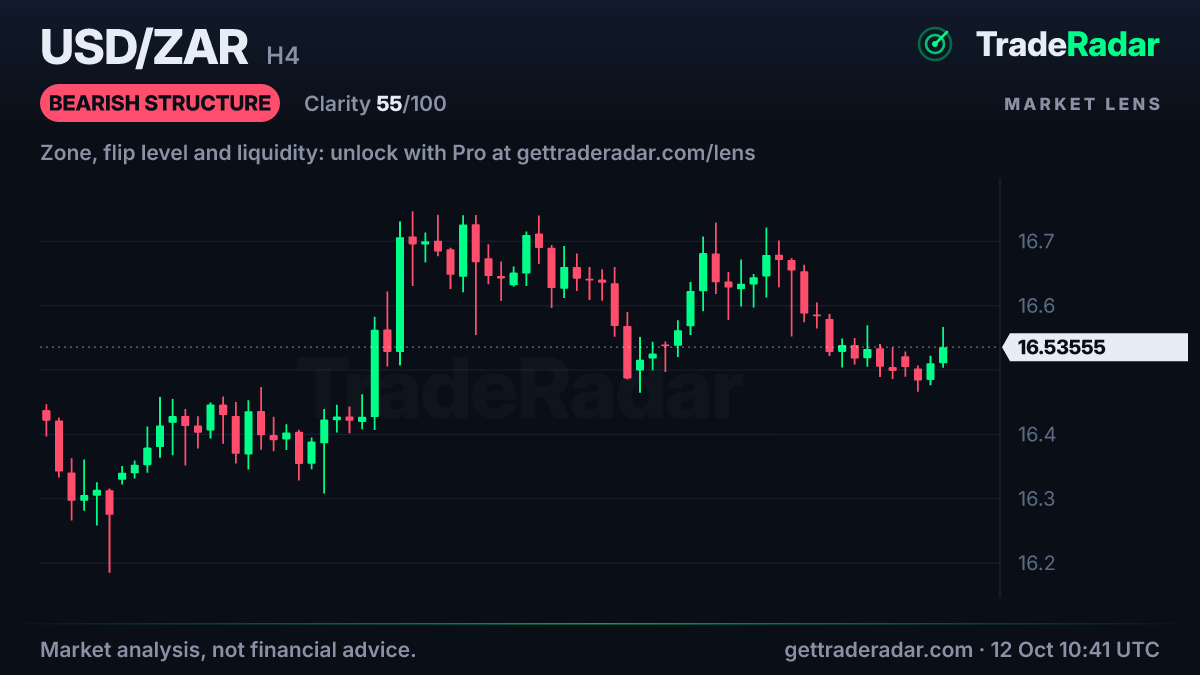
Candles and bias are public. The zones, the flip level and the liquidity on this chart open with a free account (one market a day) or Pro. Open the live interactive chart.
The structure read in plain English
The 1-hour on USD/ZAR is bearish, but the weekly is ranging and the daily bullish, so for now this is a move inside a larger structure that does not fully agree with it.
Price is trading inside a 1-hour supply zone right now. Structure clarity is 55/100 (moderate): part of the picture agrees, part does not.
Session right now: London.
USD/ZAR key levels today
Price is trading inside a 1-hour supply zone right now.
The exact zone, the structure flip level, the liquidity above and below and the previous day and week highs and lows for USD/ZAR are open today for Pro, or free with the daily unlock on a free account. Every page shows the bias for free; levels are where the work is.
Already have an account? Open USD/ZAR on Market Lens.
What moves USD/ZAR
The SARB repo rate
The South African Reserve Bank sets the repo rate about every two months. A higher rate relative to the US makes the rand pay more to hold (the "carry"), which tends to support it; a surprise cut or a dovish statement usually weakens it.
US inflation, jobs and the Fed
US CPI, Non-Farm Payrolls and FOMC decisions move the dollar side. Hot US data and a hawkish Fed usually lift USD/ZAR; soft data usually pulls it down. These releases land at 14:30 or 20:00 SAST (15:30 / 21:00 in the US winter).
Global risk sentiment
The rand is a "risk" currency: when stocks fall and investors run to safety, money leaves emerging markets and USD/ZAR tends to jump. Calm, rising equity markets usually favour the rand.
Commodities: gold, platinum and coal
South Africa exports gold, PGMs, iron ore and coal, so stronger metal prices improve the trade balance and often help the rand. A falling gold price is rarely good news for ZAR.
Local politics, Eskom and ratings
Load-shedding, budget and debt headlines, coalition politics and credit-rating reviews add a South Africa-specific risk premium that can move USD/ZAR on days when the dollar itself is quiet.
Upcoming high-impact events for USD/ZAR (SAST)
| When (SAST) | Event | Currency |
|---|---|---|
| Existing Home Sales | USD | |
| Inflation Rate MoM | USD | |
| Inflation Rate YoY | USD | |
| Core Inflation Rate YoY | USD | |
| Core Inflation Rate MoM | USD | |
| PPI MoM | USD | |
| Retail Sales MoM | USD | |
| Fed Chair Warsh Speech | USD |
High-impact releases for the currencies that move USD/ZAR, next 7 days. Spreads can widen and price can gap around them. Full economic calendar in SAST.
USD/ZAR trading hours in South African time
Open now: closes Fri 16 Oct, 23:00 SAST.
- Forex trades 24 hours from Sunday 23:00 to Friday 23:00 SAST.
- The most liquid window is the London–New York overlap, 14:00–18:00 SAST.
Times are for this week's US and UK clock settings; South Africa stays on SAST (UTC+2) all year. All forex sessions in SAST.
Trading USD/ZAR from South Africa
For South African traders USD/ZAR is quoted in rand, so a pip (0.0001) is worth R10 per standard lot with no currency conversion. Spreads are wider than on EUR/USD and widen further outside the London and New York sessions, so the quiet hours after 23:00 SAST are usually the most expensive time to trade it. Local data (CPI, the SARB decision) comes out at 10:00 or 15:00 SAST.
Contract and pip value: One standard lot is $100,000. A pip is 0.0001, worth R10 per lot (R1 on 0.10 lots, R0.10 on 0.01 lots). Some brokers quote USD/ZAR to 5 decimals, so one "point" is a tenth of a pip.
Size a position from your stop and your rand risk with the lot size calculator, or check what a pip is worth with the pip value calculator in rand.
Frequently asked questions
Is USD/ZAR bullish or bearish today?
At Mon 12 Oct, 11:45 SAST the 1-hour structure on USD/ZAR was bearish, with the weekly ranging, the daily bullish and the 4-hour ranging. This page refreshes every 15 minutes. It describes the current market structure, not a forecast or a recommendation.
What time does USD/ZAR trade in South Africa?
Forex trades 24 hours from Sunday 23:00 to Friday 23:00 SAST. The most liquid window is the London–New York overlap, 14:00–18:00 SAST.
Why does a higher USD/ZAR mean a weaker rand?
USD/ZAR is the number of rand one dollar buys. When it rises from 17.50 to 18.00, each dollar costs more rand, so the rand has weakened.
When does the SARB announce interest rates?
The Monetary Policy Committee meets six times a year; the statement is usually published around 15:00 SAST on the last day of the meeting. Check the economic calendar for the next date.
Is USD/ZAR good for small accounts?
Its daily range in pips is large and spreads are wider than the majors, so a structure-based stop is often several hundred pips. Size the position from your stop with the lot size calculator before you decide.
Related markets
Go further with TradeRadar
Free account
Today's #1 market read in full, one more market of your choice every day, and the 06:30 "top 5 to watch" email. No card.
Market Lens, live
The interactive chart with every zone, BOS/CHoCH, liquidity and premium/discount drawn on H1, H4, D1 and W1 for 26+ markets, refreshed every 15 minutes.
Open Market LensTrade Panel for MT5
The same structure read on the chart you trade in MetaTrader 5 or 4, with a lot size from your risk %. Nothing is placed without your Yes.
See the Trade PanelLast updated . General market analysis generated automatically from price data, refreshed every 15 minutes. Not financial advice and not a recommendation to buy or sell. TradeRadar is not an authorised financial services provider. Trading leveraged products such as CFDs carries a high risk of losing money.