EUR/JPY today: structure and drivers
EUR/JPY is the euro against the yen. It behaves like a risk gauge: it tends to rise when markets are calm and fall quickly when investors seek safety in the yen.
EUR/JPY structure today: the bias on every timeframe
EUR/JPY: higher timeframes disagree, no top-down direction.
| Timeframe | Structure | What it means |
|---|---|---|
| Weekly (W1) | Bearish | Lower highs and lower lows |
| Daily (D1) | Ranging | Overlapping swings, no clear direction |
| 4-hour (H4) | Bullish | Higher highs and higher lows |
| 1-hour (H1) | Bearish | Lower highs and lower lows |
Clarity score 47/100 · 1 of 3 higher timeframes agree with the 1-hour · read top-down: W1 → D1 → H4 for direction, H1 for the zone.
EUR/JPY chart (4-hour)
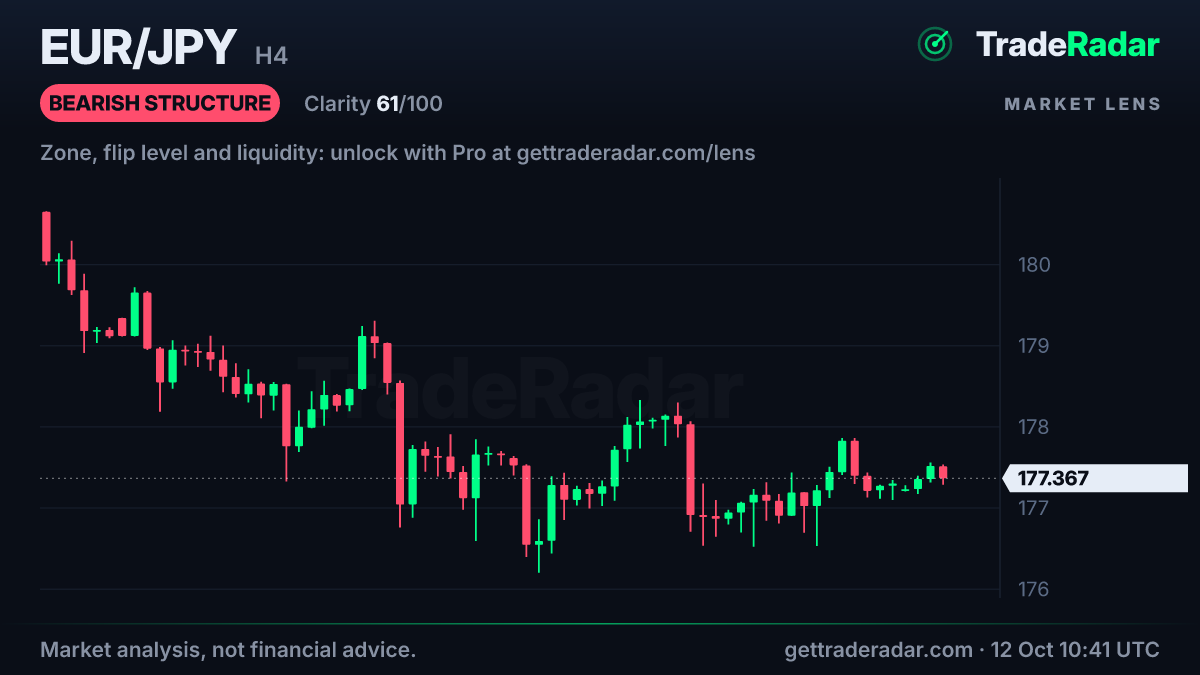
Candles and bias are public. The zones, the flip level and the liquidity on this chart open with a free account (one market a day) or Pro. Open the live interactive chart.
The structure read in plain English
On EUR/JPY the higher timeframes disagree (the weekly is bearish, the daily ranging and the 4-hour bullish), so there is no top-down direction. The 1-hour is bearish, which on its own is not the main story.
Price is close to a 1-hour supply zone (within about one average hourly range). Structure clarity is 47/100 (moderate): part of the picture agrees, part does not.
Session right now: London.
EUR/JPY key levels today
Price is close to a 1-hour supply zone (within about one average hourly range).
The exact zone, the structure flip level, the liquidity above and below and the previous day and week highs and lows for EUR/JPY are open today for Pro, or free with the daily unlock on a free account. Every page shows the bias for free; levels are where the work is.
Already have an account? Open EUR/JPY on Market Lens.
What moves EUR/JPY
ECB versus BoJ
The rate gap between Europe and Japan drives the carry trade.
Risk sentiment
Sell-offs strengthen the yen and drag EUR/JPY down.
Japanese intervention
Yen-buying intervention hits every yen cross at once.
Upcoming high-impact events for EUR/JPY (SAST)
| When (SAST) | Event | Currency |
|---|---|---|
| ECB President Lagarde Speech | EUR | |
| ECB President Lagarde Speech | EUR |
High-impact releases for the currencies that move EUR/JPY, next 7 days. Spreads can widen and price can gap around them. Full economic calendar in SAST.
EUR/JPY trading hours in South African time
Open now: closes Fri 16 Oct, 23:00 SAST.
- Forex trades 24 hours from Sunday 23:00 to Friday 23:00 SAST.
- The most liquid window is the London–New York overlap, 14:00–18:00 SAST.
Times are for this week's US and UK clock settings; South Africa stays on SAST (UTC+2) all year. All forex sessions in SAST.
Trading EUR/JPY from South Africa
A pip is 0.01, ¥1,000 per lot. The pair is active from the Tokyo session (02:00 SAST) through London.
Contract and pip value: One standard lot is €100,000. A pip is 0.01, worth ¥1,000 per lot.
Size a position from your stop and your rand risk with the lot size calculator, or check what a pip is worth with the pip value calculator in rand.
Frequently asked questions
Is EUR/JPY bullish or bearish today?
At Mon 12 Oct, 11:45 SAST the 1-hour structure on EUR/JPY was bearish, with the weekly bearish, the daily ranging and the 4-hour bullish. This page refreshes every 15 minutes. It describes the current market structure, not a forecast or a recommendation.
What time does EUR/JPY trade in South Africa?
Forex trades 24 hours from Sunday 23:00 to Friday 23:00 SAST. The most liquid window is the London–New York overlap, 14:00–18:00 SAST.
Why is EUR/JPY called a risk gauge?
Because the yen strengthens when investors get nervous, EUR/JPY tends to fall in sell-offs and rise when risk appetite returns.
Related markets
Go further with TradeRadar
Free account
Today's #1 market read in full, one more market of your choice every day, and the 06:30 "top 5 to watch" email. No card.
Market Lens, live
The interactive chart with every zone, BOS/CHoCH, liquidity and premium/discount drawn on H1, H4, D1 and W1 for 26+ markets, refreshed every 15 minutes.
Open Market LensTrade Panel for MT5
The same structure read on the chart you trade in MetaTrader 5 or 4, with a lot size from your risk %. Nothing is placed without your Yes.
See the Trade PanelLast updated . General market analysis generated automatically from price data, refreshed every 15 minutes. Not financial advice and not a recommendation to buy or sell. TradeRadar is not an authorised financial services provider. Trading leveraged products such as CFDs carries a high risk of losing money.